Every summer, some team gives a player a nine-figure deal and half the internet proclaims it the worst contract in league history. Every February, some team gets 24 minutes a night of legitimate production out of a player on the veteran minimum and the same half the internet calls that front-office wizardry.
Both proclaim the same thing: that salary should correlate to performance and that any disconnect should be the result of error on somebody’s part.
I wanted to examine the first of those claims. How closely does salary correlate to performance during the 2025-26 regular season? And if there is a correlation, how much of a player’s performance can be predicted based solely on his cap hit?
Short answer: Yes, and it’s quite strong – r ≈ 0.75, R² ≈ 0.56. Salary accounts for slightly more than half of a player’s on court production.
Longer answer: Much of that value is actually performing something other than what it appears to. When we remove the circular relationships, salary’s true predictive power is nearly halved. This is the result I found. It took me three attempts at the data to discover this.
Data
Using cleaned player names I joined per game box score data with scraped salary data for the 2025-26 season. I required a minimum of 10 games and an assigned salary. 456 players meet these criteria.
Two metrics of on court performance:
- Points per game. Simple, and the stat that is most often debated.
- Production per game = PTS + REB + AST + STL + BLK − TOV. The mean for this statistic in the sample is 16.6.
The second metric has its own issues which I will return to later. This metric is similar to the previous NBA efficiency metric without the shooting penalty. True EFF subtracts missed field goals and missed free throws. My metric does not do this. A guard who takes 22 shots to get 19 points will be rated the same as a guard who takes 12 shots.
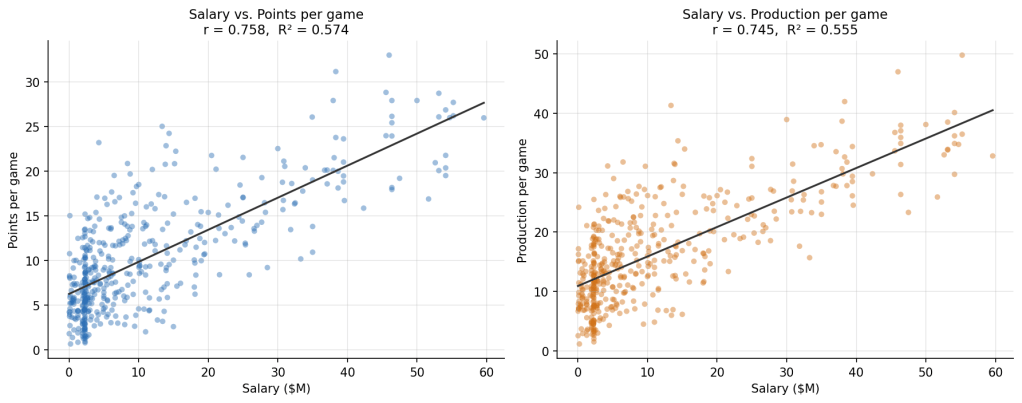
Salary against points per game and total production, 2025-26. Each dot is one of 456 players; the line is the OLS fit.
| Relationship | r | R² | p |
|---|---|---|---|
| Salary vs. points per game | 0.758 | 0.574 | 3.4 × 10⁻⁸⁶ |
| Salary vs. production per game | 0.745 | 0.555 | 6.1 × 10⁻⁸² |
Teams aren’t just throwing darts blindly though. A correlation of 0.75 across hundreds of independently negotiated contracts indicates a fairly strong relationship in a real-world system. Given only a player’s salary, I can make a materially better guess about that player’s performance than someone who knows nothing.
Two things that jump out. First, Spearman’s rho, the rank correlation (which is independent of the shape of the relationship), is only 0.68. This means that some of the 0.75 correlation is due to the linear nature of the relationship. Second, log(salary) does worse, not better (r = 0.649). I was surprised by this. The relationship is actually closer to linear when using raw salary rather than log salary. This is not what one would expect based on the shape of the salary distribution.
The regression equation is:
production per game = 10.94 + 0.496 × (salary in $M)
So about 0.5 production per million dollars, starting from approximately 11 production for a hypothetical free agent. The intercept is doing a lot here and this is just the first of several clues that will be dropped along the way.
The part that’s circular:
Here’s the result that completely drove this post.
Salary buys minutes, and minutes generate counting stats. Coaches play expensive players. Expensive players thus get more minutes and therefore more points, rebounds and assists. This isn’t necessarily due to improved performance per minute but simply due to being on the court for more minutes.
The data here is pretty clear:
- Salary vs. minutes per game: r = 0.614
- Minutes per game vs. production: r = 0.901 (R² = 0.812)
Minutes account for 81% of the variation in production per game. Salary accounts for 56%. Minutes is not some confounding variable hiding in the corner of this analysis. Minutes is actually most of this analysis.
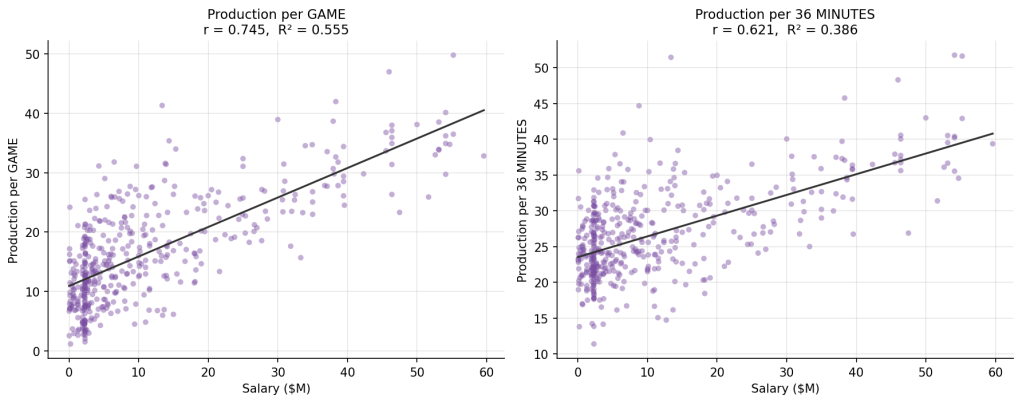
The same players, per game and per 36 minutes. Holding minutes constant cuts salary’s explanatory power from 55.5% to 38.6%
| Basis | Salary vs. production |
|---|---|
| Per game | r = 0.745, R² = 0.555 |
| Per 36 minutes | r = 0.621, R² = 0.386 |
| Partial correlation, controlling for minutes | r = 0.560, R² = 0.314 |
Explained variance falls from 55.5% to 31.4%. About 43% of salary’s apparent predictive power is the salary → minutes → box score channel, not salary tracking per-possession quality.
That doesn’t make the remaining 31% fake. Controlling for minutes, salary still correlates at 0.56 with production, which is a real and substantial relationship. But the honest headline is that salary predicts about a third of per-minute production, not more than half of it. The bigger number is inflated by a coaching decision feeding back into the stat sheet.
Two other things the headline number is quietly resting on:
Salary is backward-looking. A 2025-26 cap hit was negotiated one to five years earlier, based on what the player did before he signed. So this isn’t “teams can predict performance” — it’s closer to “past performance predicts future performance, and contracts are a lagging record of past performance.” The predictive work is being done by career stability; salary is the paperwork trailing it.
Availability is not priced in at all. Salary vs. games played comes back at r = 0.106 — essentially nothing. Expensive players are no more likely to be on the floor than cheap ones. Median games played in this sample is 58, and only 25% of players hit 70. Since these files arrive with the 10-game filter already applied, I can’t see who got dropped for injury, which means the true relationship between money and availability is invisible here. For a study of on-court production that’s fine. For any claim about whether contracts are good investments, it’s disqualifying — games missed is a first-order component of contract value and this dataset can’t speak to it.
Rookie scale vs. veteran max, and why the obvious result is a trap
The notebook compares production per $1M across two tiers:
| Tier | n | Mean prod/$M | Median | SD |
|---|---|---|---|---|
| Under $5M | 212 | 14.69 | 4.84 | 37.18 |
| Over $30M | 56 | 0.75 | 0.75 | 0.14 |
A 19.5x gap in the means. Overwhelmingly significant by any test.
It’s also almost entirely uninteresting, and the diagnostics say so plainly:
- Correlation between production-per-million and 1/salary:r = 0.802
- Spearman correlation between production-per-million andsalary:rho = −0.857
Production-per-million is production divided by salary. The numerator varies about 5x across the league; the denominator varies 2,500x — from $23,546 to $59.6M. Ranking by that ratio is, to a very good approximation, ranking players by one over their salary. The t-test is confirming arithmetic.
Look at the mean-versus-median gap in the cheap tier: mean 14.69, median 4.84, SD 37.18. That distribution is being torn apart by a handful of players on prorated 10-day and two-way deals:
| Player | Salary | Production | Prod/$M |
|---|---|---|---|
| A.J. Lawson | $26,394 | 6.7 | 254.2 |
| Bez Mbeng | $73,153 | 17.2 | 235.0 |
| Tyler Burton | $73,153 | 16.3 | 222.1 |
A.J. Lawson is not 340 times better value than Nikola Jokić. He signed a 10-day contract.
On the statistics: stats.ttest_ind defaults to equal_var=True, and these groups have standard deviations of 37.18 and 0.14. That assumption is badly violated. Running it correctly:
- Student’s t (as written): t = 2.80, p = 0.0055
- Welch’s t (
equal_var=False): t = 5.46, p = 1.4 × 10⁻⁷ - Mann-Whitney U: p = 4.0 × 10⁻³⁰
Just wanted to note that we were initially understating and not overstating the effect. By combining that huge amount of variation in the cheap players we increased the standard error. This change improves the result because now it is stronger. However, it is still a division result.
But the story behind the result is true. Both the rookie and max salaries are collectively negotiated, not set by the free market. Rookie contracts are set by draft position and max contracts are a percentage of the cap based on number of years of service. The CBA intentionally keeps the top players from being paid what the free market would offer and also underpay for four years on good young players. The surplus in the rookie contracts is not a mistake that was uncovered by someone. Instead it is the mechanism that the league intended. Also, “acquire cheap young talent” is something that all 30 front offices currently employ.
What the notebook’s value tables actually show
Ranked by production per dollar among players making at least $1M, the “worst value” list is:
| Player | Team | Salary | Production | Prod/$M |
|---|---|---|---|---|
| Jonathan Isaac | ORL | $15.0M | 6.2 | 0.41 |
| Maxi Kleber | LAL | $11.0M | 4.9 | 0.44 |
| Kelly Olynyk | SAS | $13.4M | 6.0 | 0.45 |
| Khris Middleton | DAL | $33.3M | 15.7 | 0.47 |
| Pat Connaughton | CHO | $9.4M | 4.5 | 0.48 |
| Zach LaVine | SAC | $47.5M | 23.3 | 0.49 |
| Paul George | PHI | $51.7M | 25.9 | 0.50 |
| Josh Green | CHO | $13.7M | 7.0 | 0.51 |
| Dorian Finney-Smith | HOU | $12.7M | 6.8 | 0.54 |
| Jimmy Butler III | GSW | $54.1M | 29.7 | 0.55 |
Jimmy Butler averaged 29.7 points per game, nearly twice the league average of 16.6. Using this metric, Butler is among the top 10 worst contracts in basketball. Paul George (25.9 points per game) is also on this list. The metric fails to differentiate between underperformers and expensive players. At $54M, the denominator exceeds the capabilities of human performance in basketball.
The fix: residuals instead of ratios
Stop dividing. Fit production against salary, then ask how far each player sits above or below the line. That asks the actual question: is this player outperforming what players at his price point typically deliver?
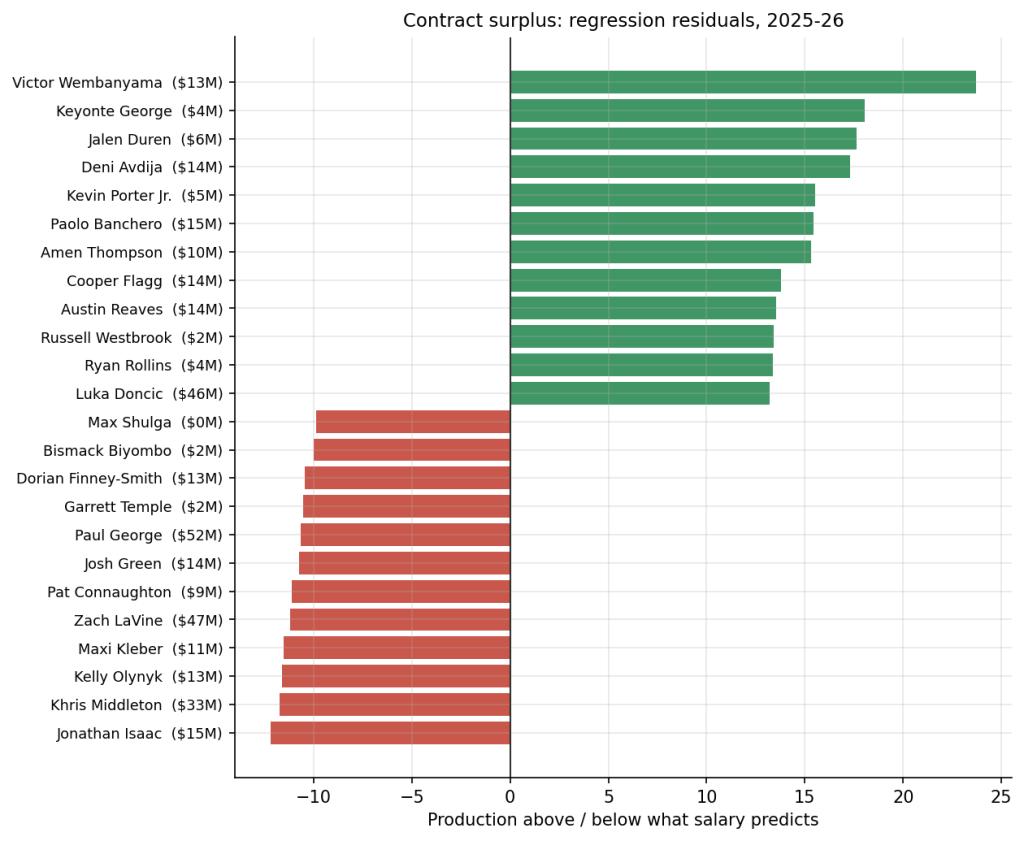
Top and bottom 12 by regression residual. Green is production above what the contract predicts; red is below.
Biggest surplus:
| Player | Team | Salary | Production | Expected | Surplus |
|---|---|---|---|---|---|
| Victor Wembanyama | SAS | $13.4M | 41.3 | 17.6 | +23.7 |
| Keyonte George | UTA | $4.3M | 31.1 | 13.1 | +18.1 |
| Jalen Duren | DET | $6.5M | 31.8 | 14.2 | +17.6 |
| Deni Avdija | POR | $14.4M | 35.4 | 18.1 | +17.3 |
| Kevin Porter Jr. | MIL | $5.1M | 29.0 | 13.5 | +15.5 |
| Paolo Banchero | ORL | $15.3M | 34.0 | 18.5 | +15.4 |
| Amen Thompson | HOU | $9.7M | 31.1 | 15.7 | +15.3 |
| Cooper Flagg | DAL | $13.8M | 31.6 | 17.8 | +13.8 |
| Austin Reaves | LAL | $13.9M | 31.4 | 17.9 | +13.5 |
Biggest deficit:
| Player | Team | Salary | Production | Expected | Surplus |
|---|---|---|---|---|---|
| Jonathan Isaac | ORL | $15.0M | 6.2 | 18.4 | −12.2 |
| Khris Middleton | DAL | $33.3M | 15.7 | 27.4 | −11.7 |
| Kelly Olynyk | SAS | $13.4M | 6.0 | 17.6 | −11.6 |
| Maxi Kleber | LAL | $11.0M | 4.9 | 16.4 | −11.5 |
| Zach LaVine | SAC | $47.5M | 23.3 | 34.5 | −11.2 |
| Pat Connaughton | CHO | $9.4M | 4.5 | 15.6 | −11.1 |
| Josh Green | CHO | $13.7M | 7.0 | 17.7 | −10.8 |
| Paul George | PHI | $51.7M | 25.9 | 36.6 | −10.7 |
That’s a leaderboard that begs for debate. Wembanyama on a rookie contract is by far the largest surplus in the league. Cooper Flagg and Keyonte George are there on merit and not small denominators. And Jimmy Butler is one of the ten “worst” contracts using the ratio method but is not on the deficit side.
Where the actual inefficiency lives
Run the residual inside the max tier alone (n = 56, everyone above $30M) and the spread is enormous:
| Player | Salary | Production | Surplus | |
|---|---|---|---|---|
| Best | Luka Dončić | $46.0M | 47.0 | +13.2 |
| Shai Gilgeous-Alexander | $38.3M | 42.0 | +12.0 | |
| Nikola Jokić | $55.2M | 49.8 | +11.4 | |
| Tyrese Maxey | $38.0M | 38.6 | +8.9 | |
| Worst | Jordan Poole | $31.8M | 17.6 | −9.1 |
| Paul George | $51.7M | 25.9 | −10.7 | |
| Zach LaVine | $47.5M | 23.3 | −11.2 | |
| Khris Middleton | $33.3M | 15.7 | −11.7 |
A 25-point production spread across players paid roughly the same money.Dončić and Middleton are separated by about $13M in salary and 31 points of production per game.
This is the whole thesis in one table. The rookie-scale surplus is a rule anyone can read in the CBA. However, the true value lies here in the top tiers, where contracts cost only a quarter of the cap and the spread between the most and least valuable contracts is larger than a whole draft class.
One more caveat: the metric rewards missing
Adding the shooting penalty back in – subtracting missed field goals and missed free throws, which is what real EFF does – drops league-average production from 16.6 to 11.9 and weakens the correlation:
| Metric | r | R² |
|---|---|---|
| Production (no shooting penalty) | 0.745 | 0.555 |
| True EFF (with penalty) | 0.721 | 0.520 |
The players that suffer the most are also as expected: Dončić (−13.9), Jaylen Brown (−12.9), Maxey (−12.0), Anthony Edwards (−11.8), and Brunson (−11.5). These are all guards who play a high volume of minutes and are rewarded by the original metric based on usage without accounting for missed shots. While this doesn’t impact any of the findings above, it does result in the above values being somewhat generous to ball-disposers.
Minor data quality note: 52 of the 508 players in the usage file do not have a corresponding salary record. This is due to the name cleaning process and not actual exclusion. Of the non-matched players, the majority are small role players (average per game stats of 9.2 compared to 16.6 for matched players, 13.7 MPG compared to 21.3 for matched players). The bias here is relatively small, but a few actual rotation players were not caught. For example, GG Jackson played 55 games with 18.0 production. A fuzzy match or join using a player identifier would catch these players.
Does salary correlate to performance?
Yes, with three caveats that are actually part of the answer:
- Per game, salary explains 56% of production. Per minute, it explains 31%.. The larger number is inflated by the salary → minutes → counting stats. Use the latter.
- The relationship is backwards. Salary represents what a player has already demonstrated. It is not a forward-looking measure, but rather a summary of the past. Salary becomes less accurate when a player’s path changes – which is precisely when you would want a forward-looking measure.
- All the value lies in the remaining unexplained variance. Simply recognizing that high-salaried players are good does not provide any benefit. Value lies in the residuals, and within the max tier, the residuals are the largest. In this tier, a 25-point difference in production is spread across contracts of similar value.
The excess in rookie contracts due to the CBA is not an advantage, but rather a mandate. The advantage comes in being able to differentiate between players like Luka Dončić and Khris Middleton before signing the contract
What I’d change
- Switch to per-100-possessions instead of per-36. This will help account for differences in pace between teams.
- Instead of dollars, use salary as a percentage of the cap. This is the unit used in the comparisons to the NFL and MLB posts.
- Break down by actual contract type (rookie scale, MLE, max, supermax, minimum, two-way) instead of arbitrary dollar amounts. This will better reflect the actual provisions outlined in the CBA.
- Add an availability adjusted version that also includes players with significant time missed during the season. This will require going upstream from the 10-game cutoff.
- Use a real performance metric (EPM, RAPTOR, or at the very least true shooting and usage) instead of a sum of box-score stats. Defense is largely invisible in PTS+REB+AST+STL+BLK−TOV.
GitHub link to project: https://github.com/zalii00/nba-salary-analysis
 The Data Dynamo